Introduction
eurolig is an R package that I just created for obtaining and analyzing basketball data games from the Euroleague. In this post I show how to use the package to analyze different aspects of the way FC Barcelona passes the ball in this Euroleague 2018-2019. More specifically, we are interested in finding out:
What type of shot each assist generates
How many points are being generated by each assist
Who assists who
How to visualize the patterns of assists
eurolig
The eurolig package is in its initial phase and still has many bugs. At the moment of writing, the package only provides tools to work with play-by-play data, but I hope to add the possibility to work with other types of data shuch as shot location data and regular boxscore stats.
The package can be installed from Github:
# install.packages("devtools")
devtools::install_github("solmos/eurolig")
Note, however, that the package is in its experimental phase and there will be numerous changes as I keep developing it. Having said that, I encourage you to download the package and play around with it. If you detect a bug or think of useful feature, please let me know.
You can keep track of new features and releases in the NEWS.md file from the package repository.
Analysis
The play-by-play data allow us to answer many questions that cannot be answered with the regular boxscore data. In this case, we will use these type of data to answer the questions of interest that we introduced above.
Data extraction
We can obtain the play-by-play data by entering the game code (or game codes) toguether with the starting year of the season we want into the extract_pbp() function.
The game code can be found in the URL of the game web page. For instance, the last game that FC Barcelona played in this Euroleague at the moment of writting was against Bayern Munich in the German city. The game URL is
https://www.euroleague.net/main/results/showgame?gamecode=219&seasoncode=E2018
We see that the game code is 219. Entering this code together with the corresponding year in extract_pbp() we obtain the play-by-play data in a tidy data frame:
library(eurolig)
game_pbp <- extract_pbp(game_code = 219, season = 2018)
game_pbp
## # A tibble: 518 x 18
## game_code play_number team_code player_name play_type time_remaining
## <fct> <int> <fct> <fct> <fct> <chr>
## 1 219 2 <NA> <NA> BP 10:00
## 2 219 3 MUN RADOSEVIC,… TPOFF 09:59
## 3 219 4 BAR TOMIC, ANTE TPOFF 09:59
## 4 219 5 BAR RIBAS, PAU 3FGM 09:37
## 5 219 6 BAR TOMIC, ANTE AS 09:35
## 6 219 7 MUN LUCIC, VLA… 2FGA 09:20
## 7 219 8 BAR TOMIC, ANTE D 09:18
## 8 219 10 BAR PANGOS, KE… 2FGA 08:58
## 9 219 11 MUN LUCIC, VLA… D 08:55
## 10 219 12 MUN JOVIC, STE… TO 08:34
## # … with 508 more rows, and 12 more variables: quarter <fct>,
## # points_home <dbl>, points_away <dbl>, team_name <fct>,
## # player_id <fct>, player_dorsal <dbl>, play_info <chr>, seconds <dbl>,
## # home_team <fct>, away_team <fct>, home <lgl>, season <int>In the present analysis we want to analyze more than just one game. Specifically, we want to obtain all the games FC Barcelona has played in this ongoing Euroleague. Instead of searching around the Euroleague website for all the different game codes, we can just use the function extract_team_pbp(). With this function we just need to enter the three letter team code and the year we want to obtain the data for all the games that the team has played in the given season.
Let’s proceed to download the data of the games that FC Barcelona has played so far (March 25, 2019):
pbp <- extract_team_pbp(team = "BAR", season = 2018)Note that the process takes a relatively long time to return the final data frame. This in not a bug. The function is designed to be slow. The Euroleague’s API documentation asks to leave a few second between succesive requests.
Analysis of assists
To answer the diferent questions that we mentioned in the introduction we are going to use the function get_assists(). Entering the play-by-play data into this function we obtain a data frame with detailed information about each assist recorded in these games. This resulting data frame can be used to answer many interesting questions with just few lines of code.
library(dplyr)
assists <- get_assists(pbp, team = "BAR")
assists
## # A tibble: 475 x 12
## game_code season passer shooter shot_type points time_remaining quarter
## <fct> <fct> <fct> <fct> <fct> <dbl> <chr> <fct>
## 1 2 2018 HEURT… CLAVER… 2FG 1 09:43 1
## 2 2 2018 CLAVE… TOMIC,… 2FG 2 08:39 1
## 3 2 2018 HEURT… TOMIC,… 2FG 2 07:44 1
## 4 2 2018 HEURT… SINGLE… 2FG 2 07:34 1
## 5 2 2018 CLAVE… SINGLE… 2FG 3 03:19 1
## 6 2 2018 ORIOL… SERAPH… 2FG 2 00:46 1
## 7 2 2018 SERAP… KURIC,… 3FG 3 00:13 1
## 8 2 2018 HEURT… ORIOLA… 2FG 2 07:08 2
## 9 2 2018 HEURT… SERAPH… 2FG 2 04:58 2
## 10 2 2018 BLAZI… PUSTOV… 2FG 2 01:17 2
## # … with 465 more rows, and 4 more variables: seconds <int>, foul <lgl>,
## # and1 <dbl>, ftm <dbl>What type of shot each player generates when he assists a teamate?
With the assists data frame we can find out what type of shot each assist leads to. An assists can lead to three point shot, a two point shot, a shooting foul (where at aleast one foul shot is made) or an and 1.
In this case, let’s say we are only interested in knowing whether the shot following an assist was a two or a three point shot. The FC Barcelona players with at least 10 assists total have distributed their assists as follows:
assists %>%
    group_by(passer) %>%
    summarise(
        assists = n(),
        two_pointers = sum(shot_type == "2FG", na.rm = TRUE),
        three_pointers = sum(shot_type == "3FG", na.rm = TRUE),
        `3pt_ratio` = round(three_pointers / assists, 3)
    ) %>%
    arrange(desc(assists)) %>%
filter(assists > 10)| passer | assists | two_pointers | three_pointers | 3pt_ratio |
|---|---|---|---|---|
| HEURTEL, THOMAS | 138 | 101 | 37 | 0.268 |
| PANGOS, KEVIN | 92 | 55 | 36 | 0.391 |
| TOMIC, ANTE | 53 | 34 | 19 | 0.358 |
| RIBAS, PAU | 47 | 33 | 14 | 0.298 |
| HANGA, ADAM | 30 | 20 | 10 | 0.333 |
| SINGLETON, CHRIS | 26 | 15 | 11 | 0.423 |
| CLAVER, VICTOR | 23 | 12 | 11 | 0.478 |
| KURIC, KYLE | 21 | 13 | 8 | 0.381 |
| ORIOLA, PIERRE | 15 | 8 | 7 | 0.467 |
| BLAZIC, JAKA | 12 | 9 | 3 | 0.250 |
| SERAPHIN, KEVIN | 12 | 8 | 4 | 0.333 |
In this case, Heurtel has the second lowest ratio of assists to three pointers with respect total assists (0.268). On the other hand, Pangos has a substantially higher proportion of assists that lead to three pointers (0.391).
It’s the big and mobile players, like Claver, Singleton or Oriola, that have the highest proportion of assists going to three pointers.
How many points each player’s assists generate?
As we have seen, not all assists are created equal. An assist to a three pointer generates two more points than an assist that results in a shooting foul where the shooter only scores one foul shot.
With the following lines of code we can compute how many points each player’s assists generated:
assists %>%
    group_by(passer) %>%
    summarise(
        assists = n(),
        points = sum(points, na.rm = TRUE),
        ppa = round(points / assists, 3)
    ) %>%
    arrange(desc(assists)) %>%
filter(assists > 10)| passer | assists | points | ppa |
|---|---|---|---|
| HEURTEL, THOMAS | 138 | 311 | 2.254 |
| PANGOS, KEVIN | 92 | 215 | 2.337 |
| TOMIC, ANTE | 53 | 121 | 2.283 |
| RIBAS, PAU | 47 | 105 | 2.234 |
| HANGA, ADAM | 30 | 68 | 2.267 |
| SINGLETON, CHRIS | 26 | 63 | 2.423 |
| CLAVER, VICTOR | 23 | 58 | 2.522 |
| KURIC, KYLE | 21 | 48 | 2.286 |
| ORIOLA, PIERRE | 15 | 36 | 2.400 |
| BLAZIC, JAKA | 12 | 26 | 2.167 |
| SERAPHIN, KEVIN | 12 | 28 | 2.333 |
The last column of this data frame (ppa) tells us how many Points Per Assist each player from FC Barcelona generates (with at least 10 assists). We observe that Claver and Singleton generate the highest value per assist, indicating that a relatively high proportion of their assists lead to a three point shot.
Who assists who?
With play-by-play data, it is also possible to find out to whom each player’s assist go to. The ten most common combinations passer-shooter are shown below:
assists %>%
    group_by(passer, shooter) %>%
    count() %>%
    arrange(desc(n)) %>%
head(10)| passer | shooter | n |
|---|---|---|
| HEURTEL, THOMAS | SERAPHIN, KEVIN | 27 |
| HEURTEL, THOMAS | TOMIC, ANTE | 24 |
| PANGOS, KEVIN | TOMIC, ANTE | 22 |
| HEURTEL, THOMAS | ORIOLA, PIERRE | 21 |
| HEURTEL, THOMAS | SINGLETON, CHRIS | 17 |
| PANGOS, KEVIN | KURIC, KYLE | 16 |
| PANGOS, KEVIN | SERAPHIN, KEVIN | 15 |
| TOMIC, ANTE | SINGLETON, CHRIS | 15 |
| HEURTEL, THOMAS | CLAVER, VICTOR | 12 |
| HEURTEL, THOMAS | KURIC, KYLE | 12 |
The five most common combination passer-shooter are all from point guard to big man. We see that Heurtel connects very well with the bigs in his team, specially the two centers, Seraphin and Tomic. This explains the low proportion of assists to three point shots that we observed before.
However, in order to have a more accurate picture we would need to know how many minutes each combination was together on the floor. This information would allow us to identify potential improvements when deciding lineups.
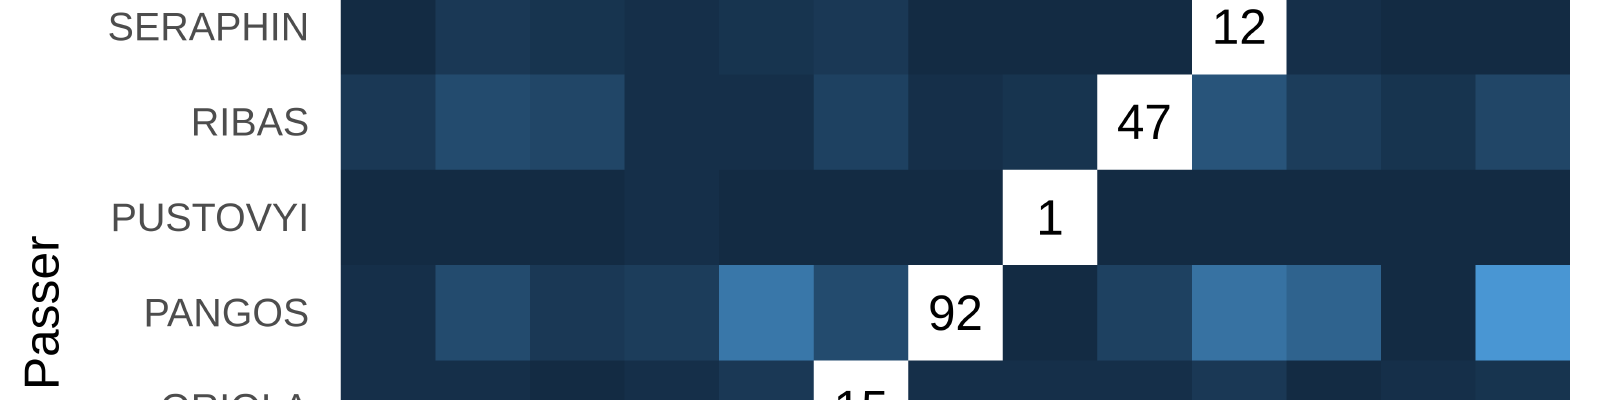
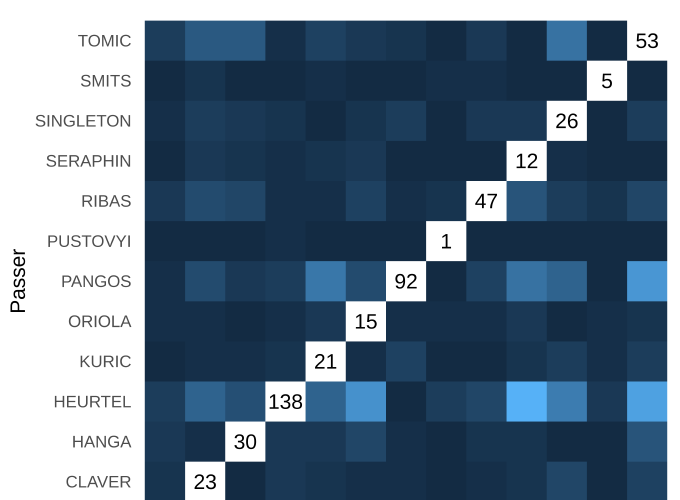
How to visualize assists
It is possible to summarise some of the data that we obtained before using a heatmap showing the distribution of assists among the players of FC Barcelona. The function plot_heatmap() does just that:
plot_heatmap(pbp, "BAR") +
    ggplot2::labs(
        title = "FC Barcelona assist heatmap",
        subtitle = "Euroleague 2018-2019 (first 28 games)",
        x = "Shooter",
        y = "Passer")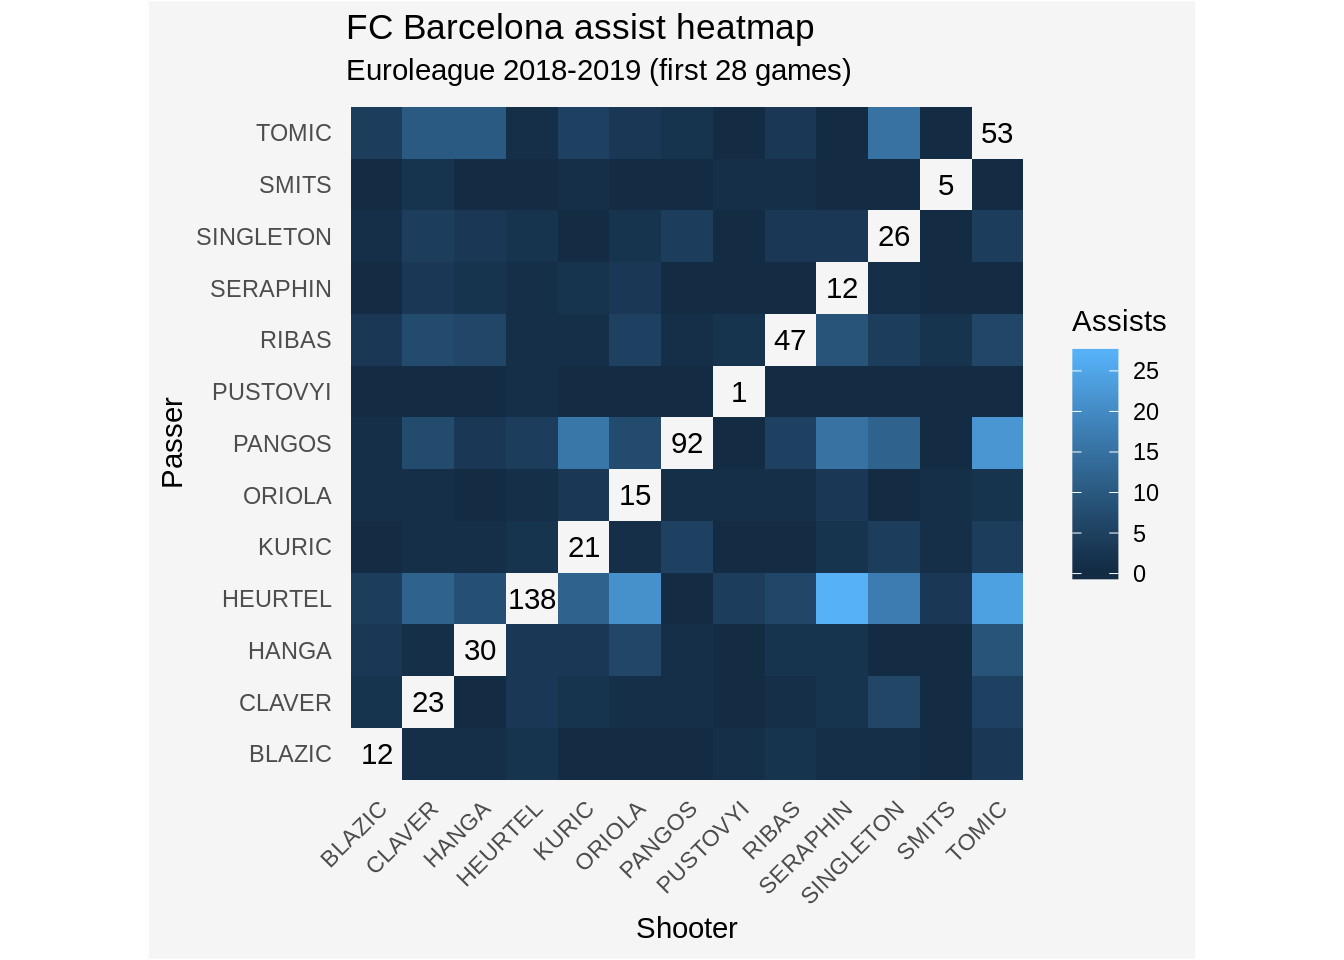
The vertical axis represents the passer while the horizontal axis represents the player that shoots after the pass. The diagonal contains the total number of assists for each player. The color indicates the number of assists that a given player gives to other player.